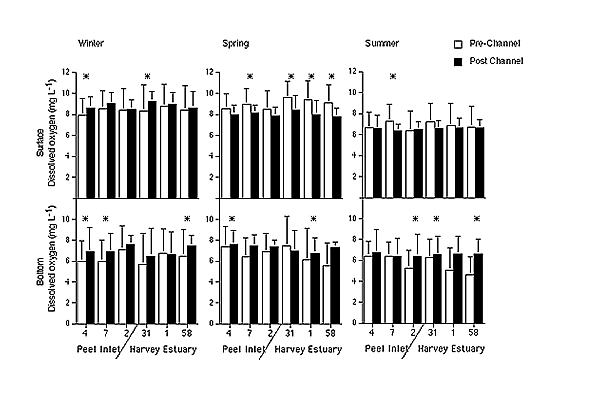
Figure 4: Mean dissolved oxygen concentrations from the six sites in the Peel Harvey Estuary during pre and post Channel years. The * represents a significant difference between pre and post Channel years. Site locations in Figure 1.
Figure 4: Mean dissolved oxygen concentrations from the six sites in the Peel Harvey Estuary during pre and post Channel years. The * represents a significant difference between pre and post Channel years. Site locations in Figure 1.