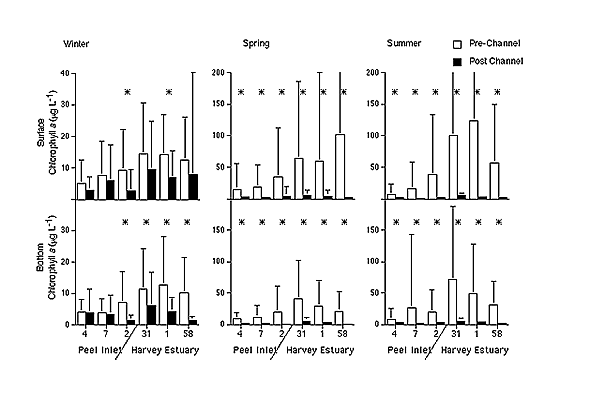
Figure 8: Mean chlorophyll a concentration from the six sites in the Peel Harvey Estuary during pre and post Channel years. The * represents a significant difference between pre and post Channel years (note the change of scale for winter). Site locations in Figure 1.