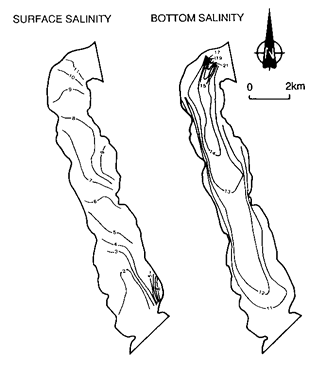
Figure 3. The distribution of salinity in the Harvey Estuary on a winter day, during river inflow. The isohalines for surface water (left) range from 2 to 11, and for the bottom water (right) from 11 to 21. Data (g L-1) were collected at a large number of sites in the estuary.