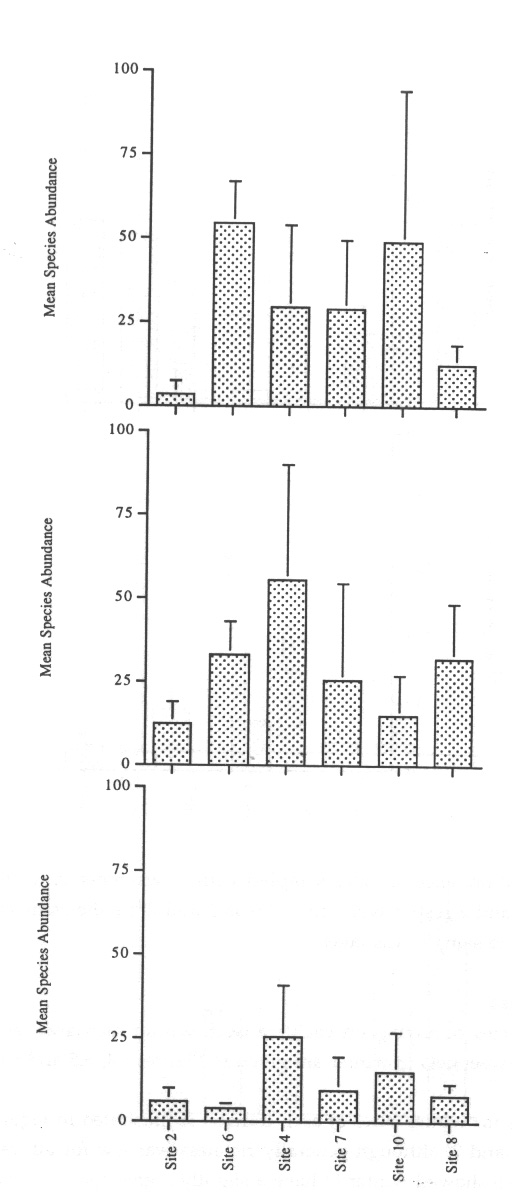
Figure 5.2
Mean species abundance for cores during winter, along a transect at selected sites, for areas 1, 2 and 3 respectively, n=4.
Areas 1, 2 and 3 are the same as on
Figure 1.2
.