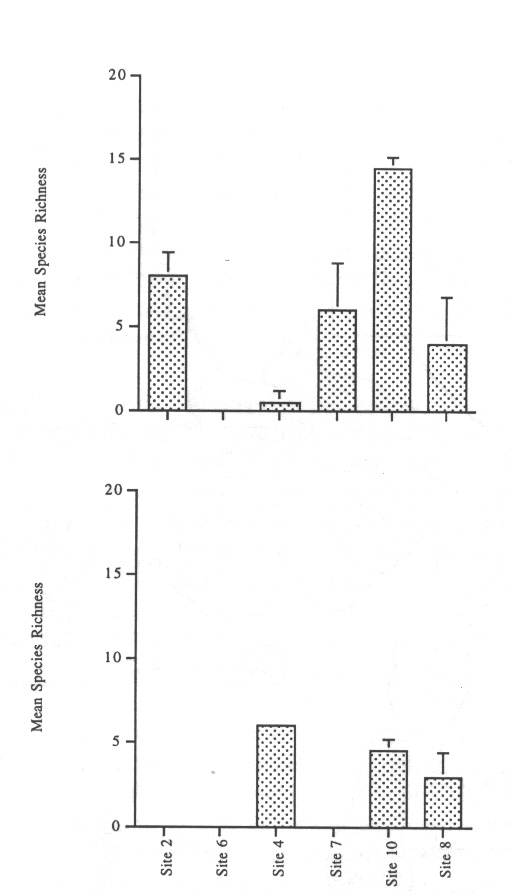
Figure 5.6
Mean species richness for sweep sites during winter along a transect at selected sites, for areas 1 and 2 respectively, n=2. Areas 1 and 2 are the same as on
Figure 1.2
. Note: Zero abundance indicates no sample taken.