INUNDATION OF THE FRINGING MARSHES
Tides at Fremantle have a daily range of only about l m, and the extreme range of sea level is about 1.3 m. Because of barometric effects, the mean monthly sea level is about 0.3 m higher in winter than in summer, though there is a large variation from year to year (Hodgkin and Di Lollo, 1956). Within the Peel-Harvey estuary the amplitude of the tides is damped because of the restriction on water flow exerted by the narrow inlet channel, so that much of the observed changes in water level are due to barometric effects coupled on occasions with river flow.
A study of tides is being carried out as part of the main Peel-Harvey project, and so the opportunity was afforded to work out the frequency with which fringing marshes may be inundated.
(a) Transects: The vegetation was recorded along several transect lines (Figure 2.1) placed through marsh vegetation, and levels taken with a theodolite and staff. It was possible to work out the absolute elevation of one of these transect lines with reasonable precision, using the Public Works Department bench mark BM A901 (1.717 m above the Mandurah tide gauge 0.0 m).
This elevation was transferred to an area between the Greenlands and Fauntleroy Drains (Roberts Bay), using a theodolite and two depths gauges measured simultaneously by two observers.
In this way elevation transects taken in the region of Roberts Bay were calibrated against the Mandurah tide gauge. Other transects were documented but these could not be related exactly to the Mandurah level. These transects were, however, taken on the same day, within 6 hours of that at Roberts Bay, with which they were therefore related in an approximate manner.
(b) Tide Information: The proportion of the year during which particular points would be inundated was provided by Mr. D. Wallace, Public Works Department (Figure 2.2). The data were for several sites in the estuary, and were for the year 1979.
Transect lines are shown in Figure 2.3 which illustrates some typical areas of vegetation; one may note the Sarcocornia marsh at the lower levels fringing the open water, and also the prominence of Scirpus maritimus. The figures also include a scale showing percentage inundation, read from Figure 2.1; these are accurate for Figure 2.3a, but more approximate for the other two transects. The data are for a year, and it will be recalled that water levels would on average be some 0.3 m higher in winter than summer. There are also fluctuations in mean sea level from year to year. Nevertheless, it is clear that the marsh vegetation is heavily inundated, especially in winter.
The Sarcocornia marsh is inundated 65-95%, the Juncus up to 80% of the time, but to as little as rarely inundated at the upper part of the transect shown in Figure 2.3c.
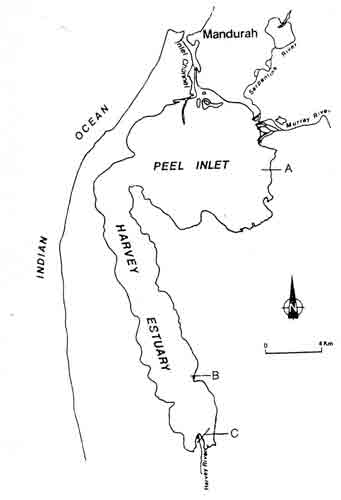
Figure 2.1: The location of the three transect lines, A, B and C shown in Figure 2.3.
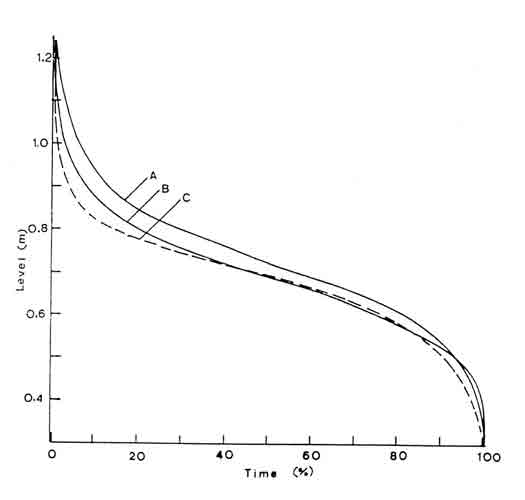
Figure 2.2: The amount of time during which particular levels are covered by water. Time is expressed as % of the year, and water level is in relation to Mandurah Datum. Curves are for A, Mandurah; B, Coodanup; C, Falcon. Data provided by Mr D. Wallace, Public Works Department.
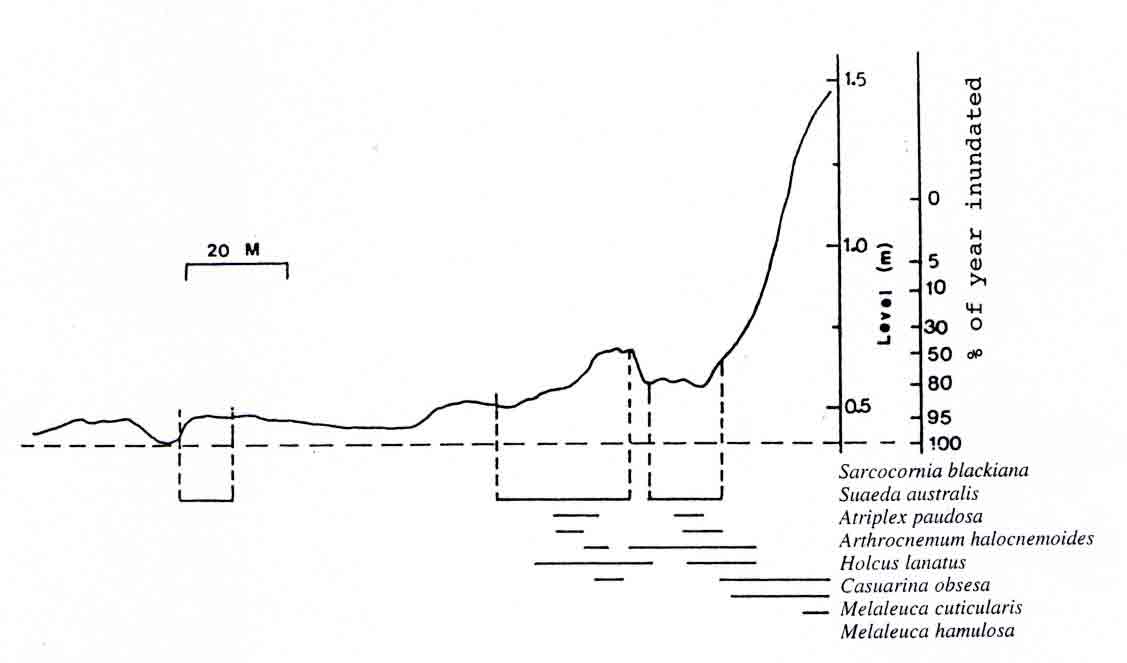
Figure 2.3: Transects through fringing plant communities. A, the profile at A, Figure 2.1. The level is accurately depicted in relation to the Mandurah Datum, and % inundation is taken from Figure 2.2.
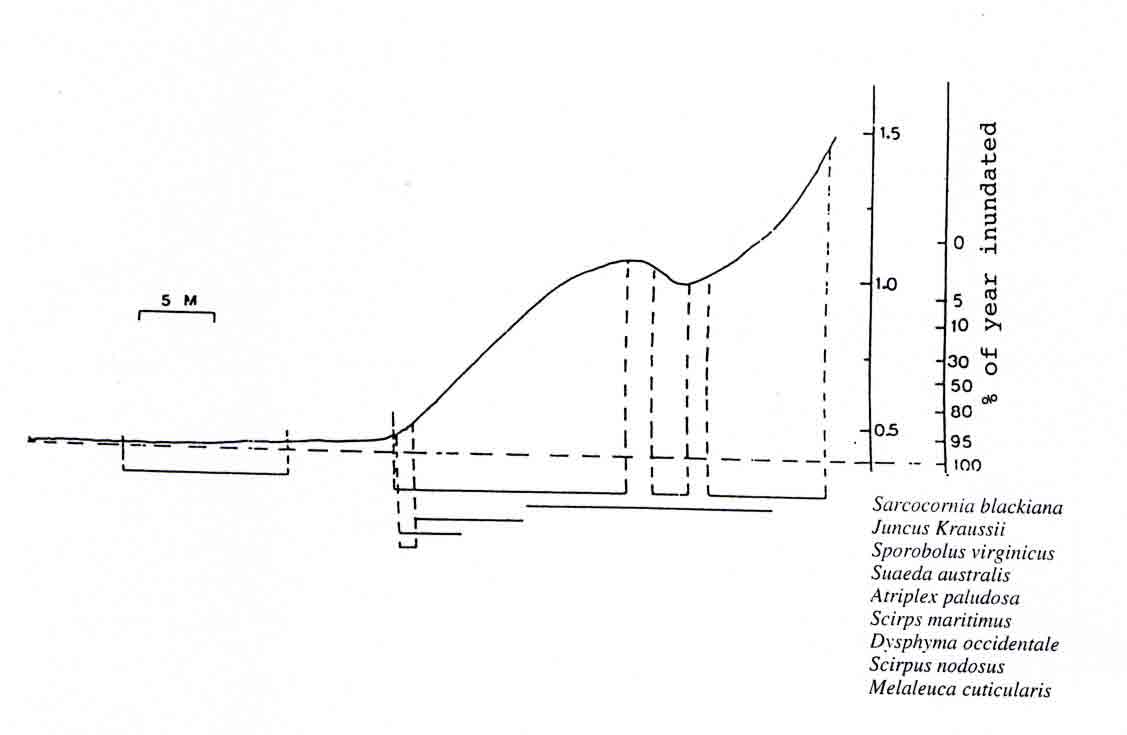
Figure 2.3 (continued): B, the profile at transect B, Figure 2.1. Relationships with Mandurah Datum are more approximate than in A.
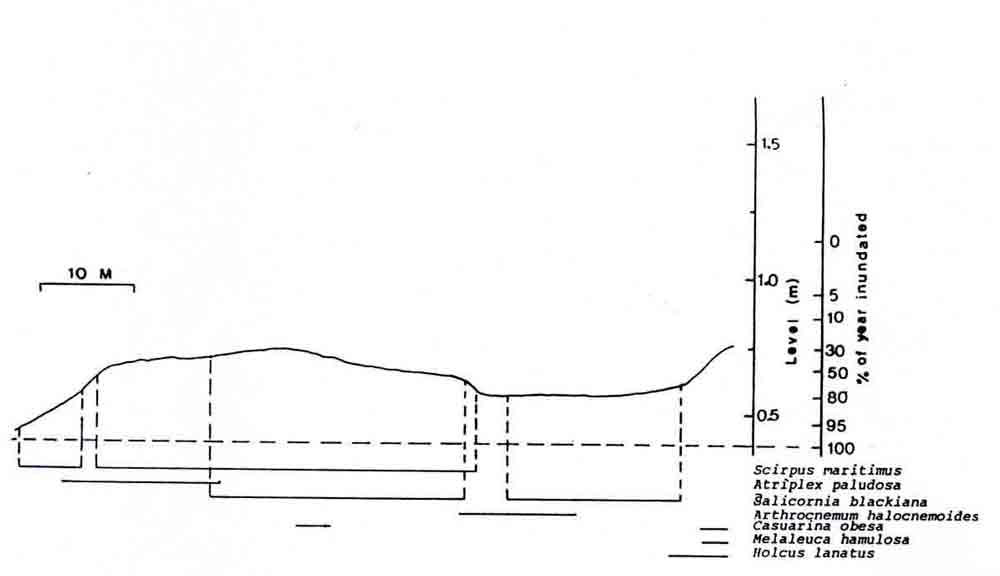
Figure 2.3 (continued): C, the profile at transect C, Figure 2.1, at the southern end of the Harvey Estuary. The relationship with the Mandurah Datum is more approximate than in A.
![]()
![]()